Features
For examples on how to add these to the options file, read the Getting Started page. Essentially, add the name of the feature you want to the “features” block. Easy as that! If you want to further customize, add the relevant options to the “features_customizations” block.
Year/Month Heatmap
Shows a heatmap of the frequency of incidents by year (row) and month (column).
Requires: latitude_column, longitude_column
Added with: “month_year_heatmap”

Year Range Map
Shows the incidents on a world map, with the years shown selected by a range.
Requires: latitude_column, longitude_column, time_column
Added with: “yearly_range”

One Year Map
Same as Year Range Map, but for one year at a time.
Requires: latitude_column, longitude_column, time_column
Added with: “one_year”
Options:
“hover_text_columns”: Columns whose data you want to show on hovering over a point on the map. Add to features_customizations with:
"hover_text_columns": [
        "ColumnName1",
        "ColumnName2:",
        ...
],
“filter_one_year_column”: Adds an extra dropdown that lets you only display points which match the selected value of the given column. Added with:
"filter_one_year_column": "ColumnName"

Month-to-Month Frequency
Histogram showing the frequency per month across all data points.
Requires: time_column
Added with: “all_months”

Month-to-Month Frequency for One Year
Month-to-Month Frequency, but for one year at a time.
Requires: time_column
Added with: “one_year_months”

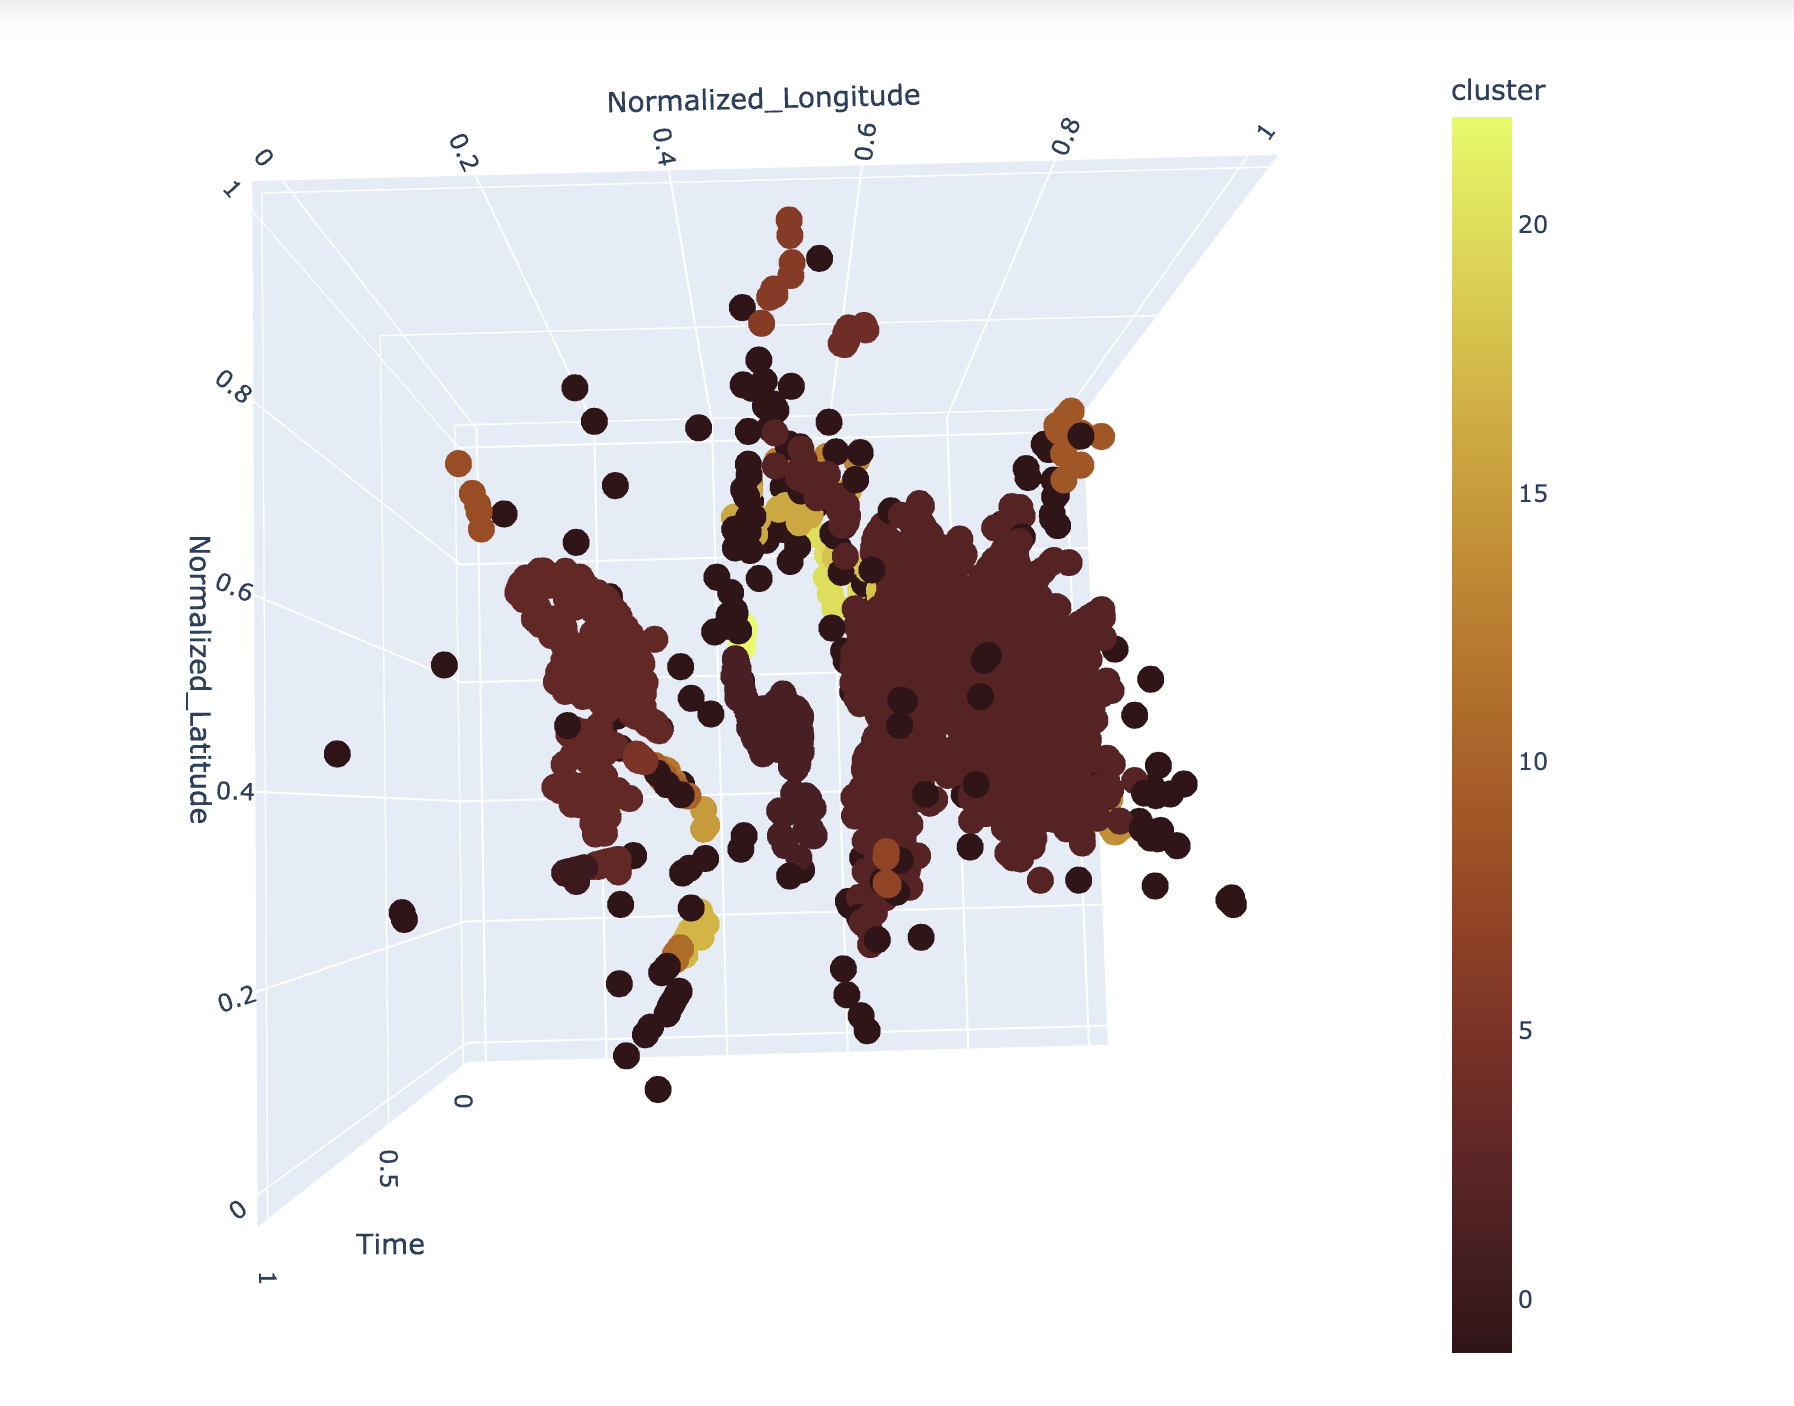
Latitude/Longitude/Time 3D Visualization
A 3D visualization of the data. Latitude, longitude, and time are each a dimension.
Requires: time_column
Added with: “threeD”
Points of Interest (POI)
A list of the most popular locations using another dataset to generate the popular locations
Requires: latitude_column, longitude_column
Added with: “poi_analysis”

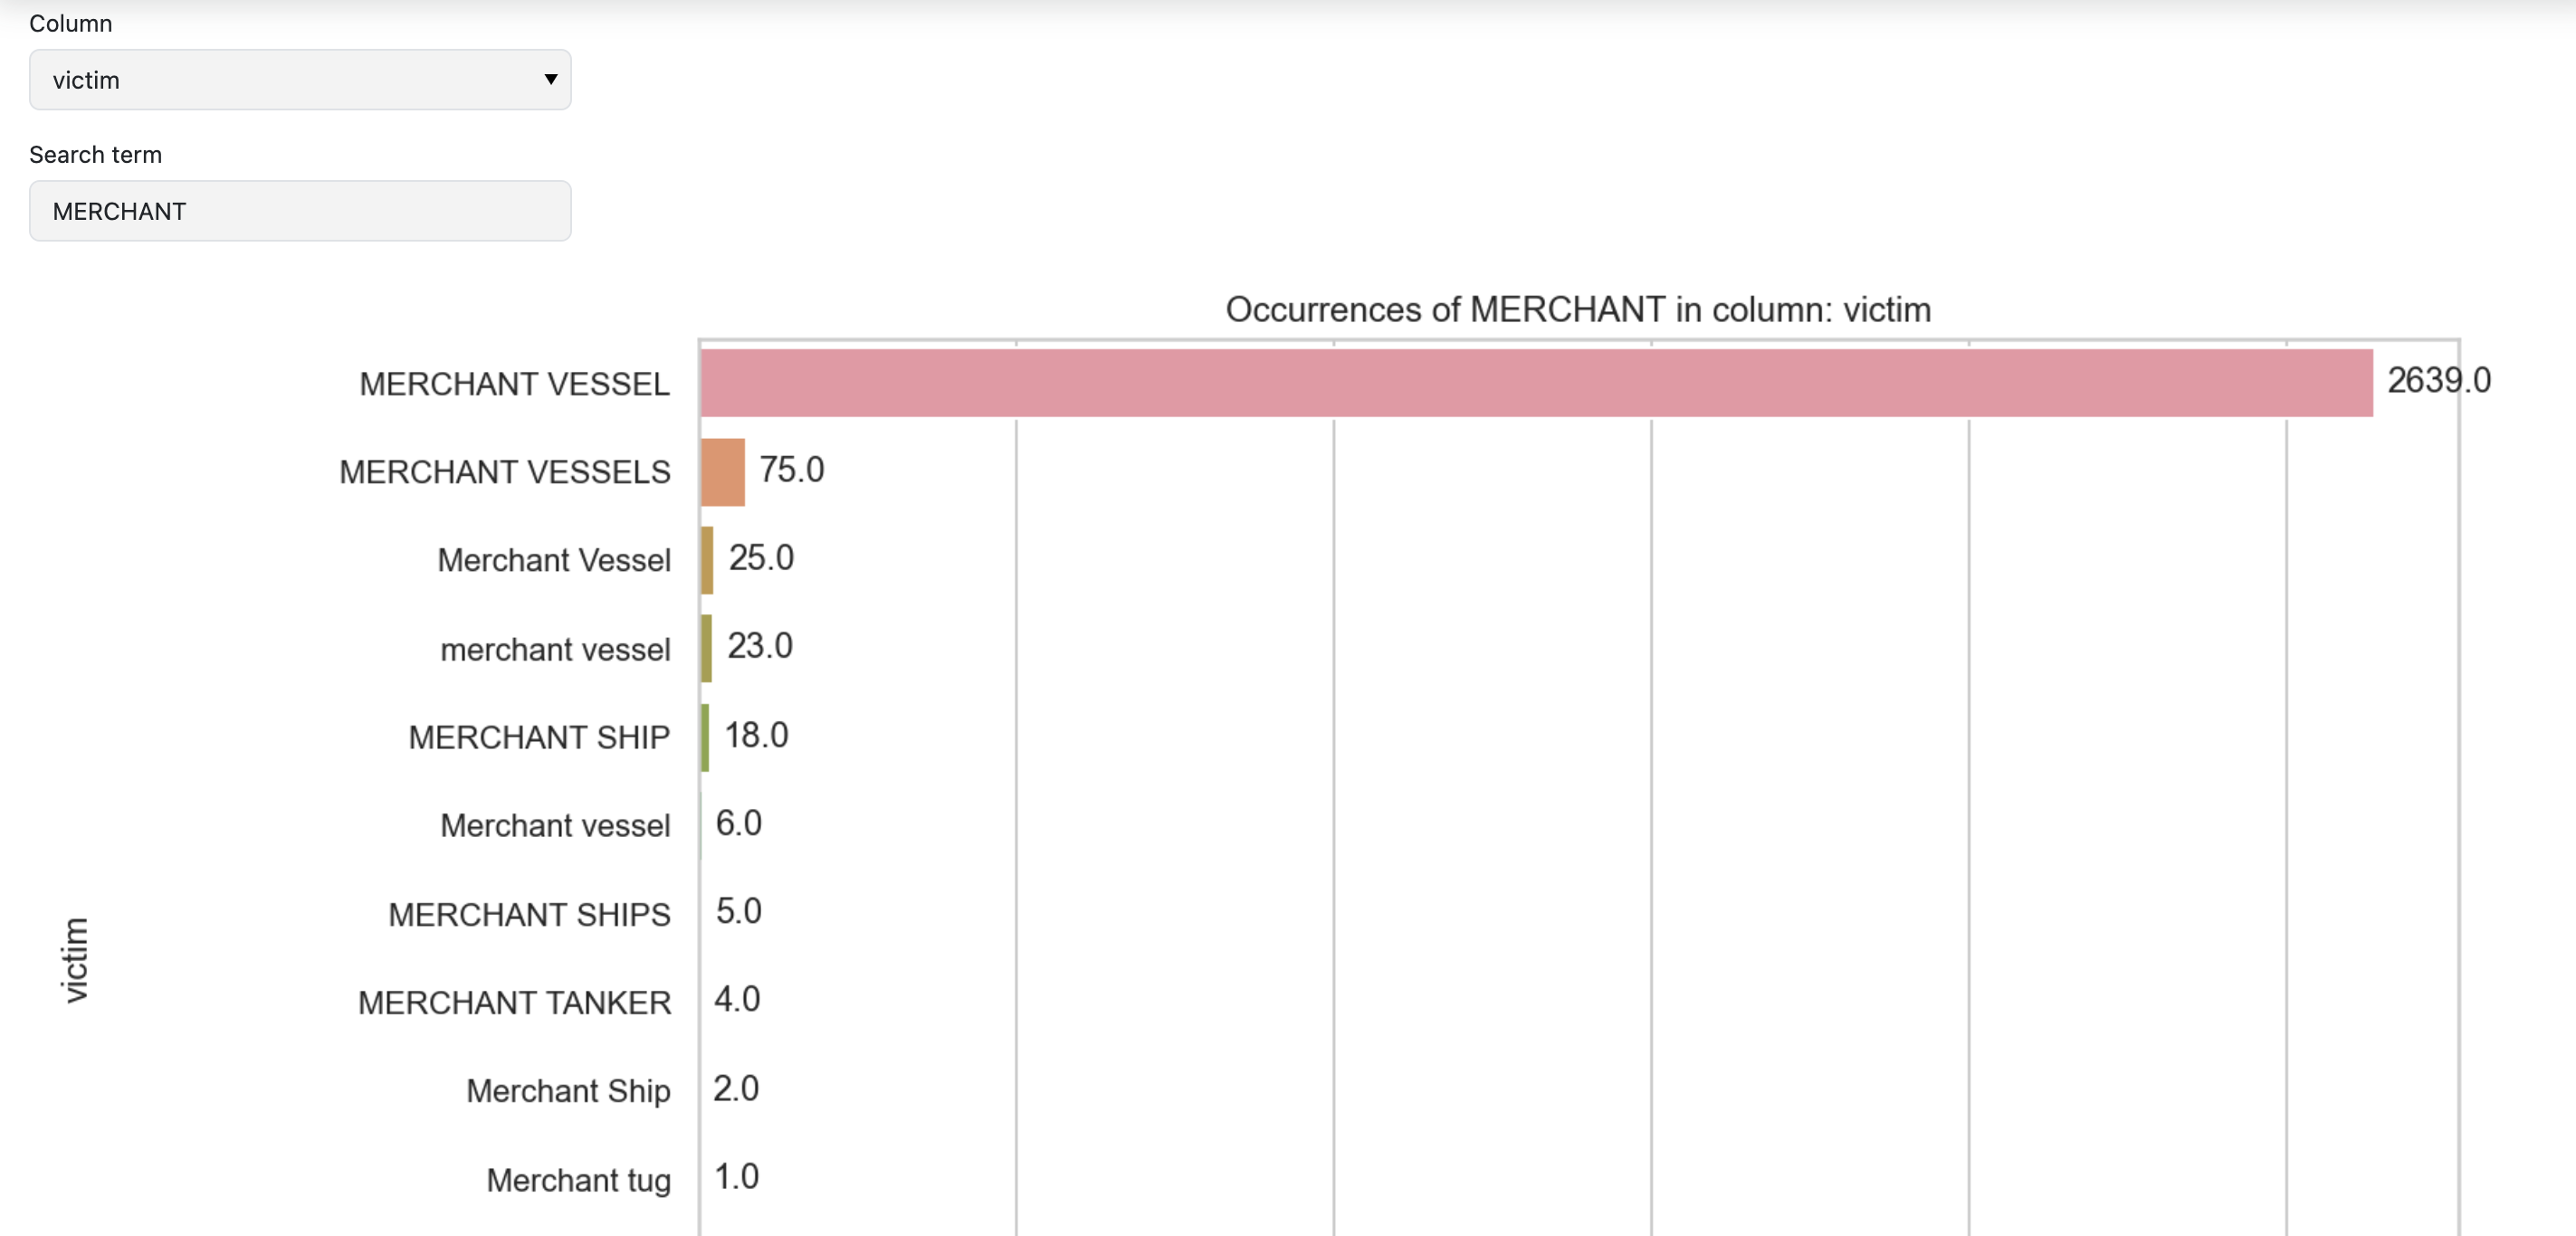
Search Key Words
A histogram showing the count of a key term in a specified column
Requires: NONE
Added with: “search_columns”
Bertopic Visualizations
A intertopic map created from BerTopic model.
Requires: description_column
Added with: “nlp_bertopics”
